START HERE
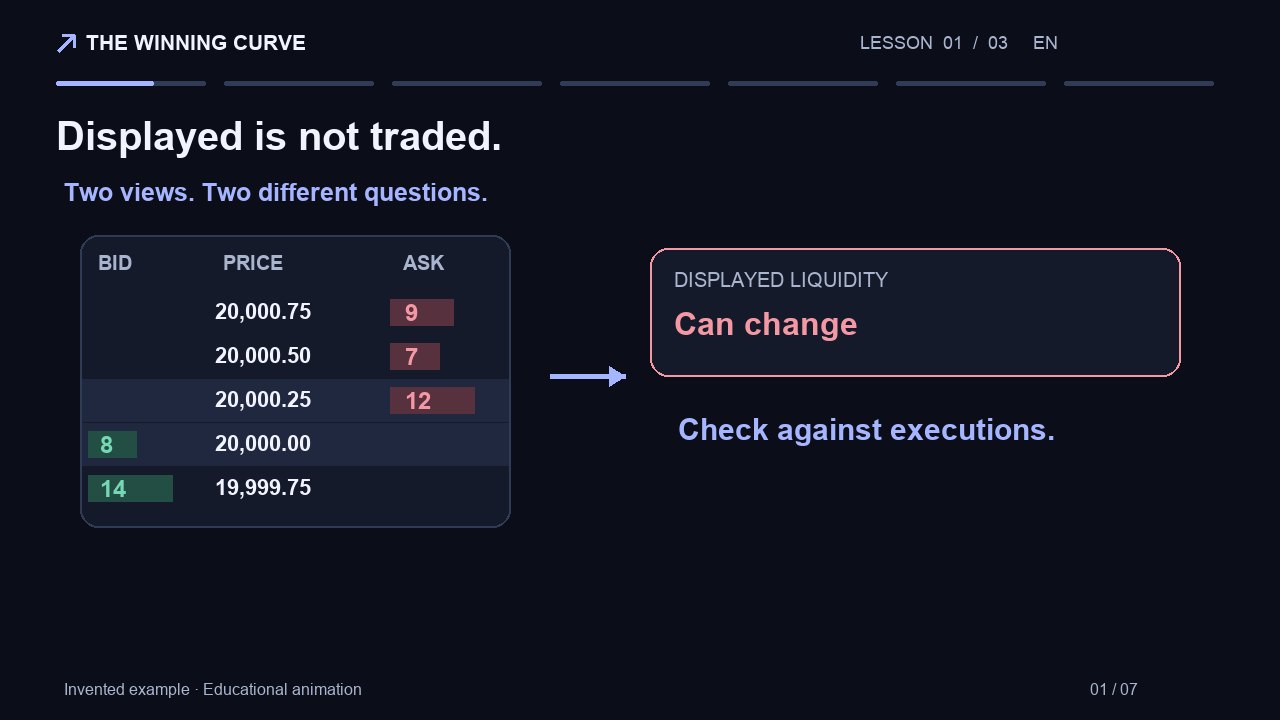
Order flow is the activity of orders and executions. A DOM shows displayed bid and ask liquidity; Time & Sales shows completed trades. Reading them together helps you describe what happened at a price, but neither predicts the next move on its own.
Prefer to watch? Order book vs executed trades: read the difference (1:38)
What is order flow trading?
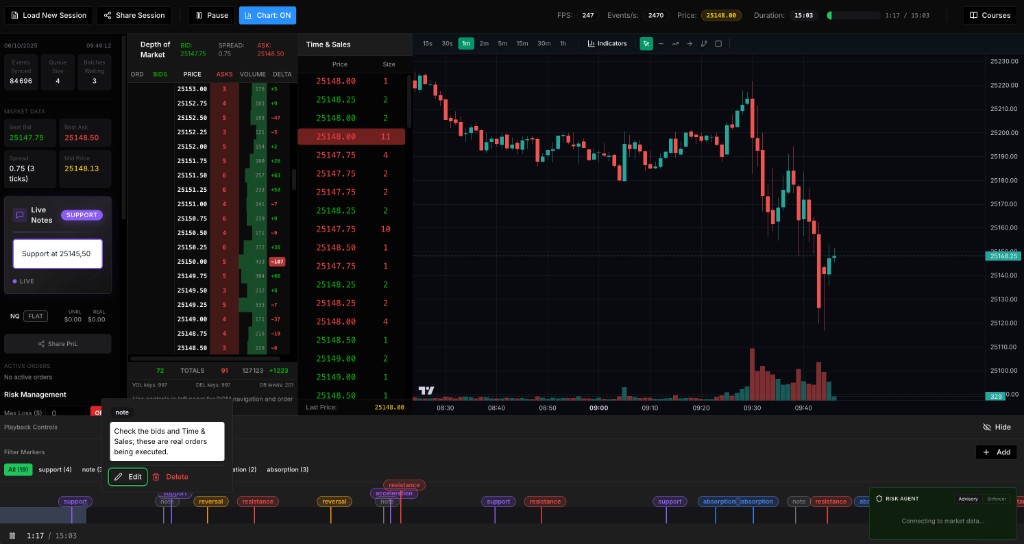
Order flow trading studies how orders interact at a price: liquidity waiting in the book, transactions that consume it, and the price response. For exchange-traded futures, the DOM (Depth of Market) and Time & Sales are two complementary views of that activity. A price chart gives you a wider view of the session.
For a beginner, the useful question is specific: “What traded at this level, and how did the price react?” It is more testable than “Are buyers in control?” Every completed trade has a buyer and a seller. When traders talk about aggressive buying, they mean the side seeking immediate execution against an available offer; they do not mean that a trade had no seller.
DOM, Time & Sales and chart: what each view answers
Keep these three observations separate in your notes. A large displayed order, a large executed volume and a large price move are different facts.
On a small screen, scroll the table horizontally.
| View | What you can observe | What it cannot establish alone |
|---|---|---|
| DOM / order book | Displayed bid and ask quantities at price levels | Whether an order will stay, trade or be cancelled |
| Time & Sales / tape | Executed price, time and reported size | The identity or intention of the trader |
| Price chart | Where the current move sits in the session | The full sequence of book changes and individual executions |
How to read the bid, ask and spread
The best bid is the highest displayed buying price; the best ask is the lowest displayed selling price. Their difference is the spread. Depth below the best bid and above the best ask shows additional displayed interest. Your feed and platform determine how many levels you can see.
A resting limit order can provide liquidity. An order that is immediately executable against the opposite side can consume liquidity. A limit order can also be aggressive if its limit permits an immediate match. Do not assume “limit” always means passive.
On a small screen, scroll the table horizontally.
| Displayed bid size | NQ price | Displayed ask size |
|---|---|---|
| — | 20,000.50 | 18 |
| — | 20,000.25 | 12 |
| 9 | 20,000.00 | — |
| 14 | 19,999.75 | — |
Reference : CME Group — Futures Order Types
A worked example: 8 contracts trade, but the price stays
In the hypothetical ladder, the best bid is 20,000.00 and the best ask is 20,000.25. The spread is 0.25 points. Suppose 8 contracts execute at 20,000.25 against the ask. If nothing else changes, the displayed ask quantity would fall from 12 to 4. That “if” matters: new orders, modifications and cancellations can arrive during the same interval.
Now suppose the tape shows those 8 contracts but the next visible book snapshot still shows 12 at the ask. You have observed executions without a net reduction in the displayed quantity. Replenishment is one possible explanation. A snapshot alone cannot tell you exactly which orders changed between updates.
Write the observation before the interpretation: “8 contracts traded at the ask; the best ask remained at 20,000.25.” Then watch the next interaction. Does price move through that level, remain there, or move away? None of those outcomes is guaranteed by the initial print.
What does absorption mean in order flow?
Traders use “absorption” to describe repeated aggressive executions meeting opposing liquidity with limited price progress. It is a description to investigate, not proof of a hidden institution or a promise of reversal. The level can eventually break even after a long period of repeated trading.
In Replay, choose a short interval and record three things: executed activity at a level, the displayed quantity across updates, and the distance price travels. Keep an alternative explanation beside your first hypothesis. For example, a quiet interval with few trades is different from heavy trading that fails to advance.
- A large ask is not automatically resistance: it can be cancelled or executed.
- Several prints do not necessarily come from several independent participants.
- A colour or volume imbalance is not an entry rule by itself.
- Recorded snapshots can miss changes that happened between captures.
A five-minute observation exercise
Open the no-account NQ Replay demo and pause it. Choose one nearby price level before you resume. Keep the same playback speed while you compare observations.
- Minute 1: locate the best bid, best ask and spread. Name what each column shows.
- Minutes 2–3: watch executions as price approaches your chosen level. Note the replay time before looking further ahead.
- Minute 4: compare the tape with the next book updates. Separate visible quantities from executed volume.
- Minute 5: replay the interval and write one fact, one hypothesis and one alternative explanation.
Build a repeatable reading process
Repeating the same known session is useful for learning the interface, but it can also train your memory of the next price move. Use one pass to discover the sequence and a second to check your notes. Later, apply the same observation checklist to a different session before judging whether your process is consistent.
The Winning Curve pairs an order flow trading course with Replay practice. Use this guide to learn the vocabulary, the course for the structured lessons, and the simulator to practise describing what you see. Live trading introduces execution and financial risks that a replay cannot reproduce completely. Training does not guarantee profitable trading.
Common questions
Is DOM the same as order flow?
DOM is a view of displayed order-book liquidity. Order flow is broader: it includes orders, modifications, cancellations and executions. Time & Sales adds the executed-trade view.
Can I learn order flow without trading live?
You can practise observation on recorded data without placing live orders. This helps with vocabulary and interface familiarity; it does not prove how you would perform with real execution and real money.
Do I need a footprint chart to start?
You can start by comparing the DOM, Time & Sales and a price chart. A footprint aggregates executed volume by price inside bars; it is another view, with different aggregation choices.
Does a large bid mean the market will rise?
No. Displayed size can change or disappear, and the price can move through it. Observe what actually executes and how price responds.
Published by The Winning Curve. Invented examples are labelled; screenshots show our interface. A correction or question about this guide? thewinningcurve@gmail.com