START HERE
Absorption describes aggressive orders meeting enough passive liquidity to limit price progress. Exhaustion describes fading aggressive participation. To tell them apart, compare executed volume, pace and price response over the same interval. Neither observation, by itself, predicts a reversal.
Video to review the basics: Order book vs executed trades: read the difference (1:38)
Absorption vs exhaustion: what changes?
A busy tape with little price progress raises a different question from a tape that becomes quiet. In the first case, investigate what is meeting the transactions. In the second, investigate whether participation is fading. Bookmap’s distinction between passive interest and declining follow-through volume is a useful starting point.
Reference : Bookmap — Absorption & Exhaustion
Read the tape, the price and the book together
Start with a small observation window rather than a trade direction. Write down the instrument, contract, market time, playback speed and tape settings. Keep those settings unchanged while comparing two windows. Counting rows alone is unreliable when several executions can be grouped into one row.
For a first exercise, use consecutive ten-second windows. This is a study format, not a universal market threshold. A useful note might say: “More ask-side volume in the second window, but the highest traded price did not increase.” That is more precise than “strong buyers”.
- Tape: which side traded, how much volume executed and how regularly?
- Price: did trades reach new prices, revisit a level or move back through it?
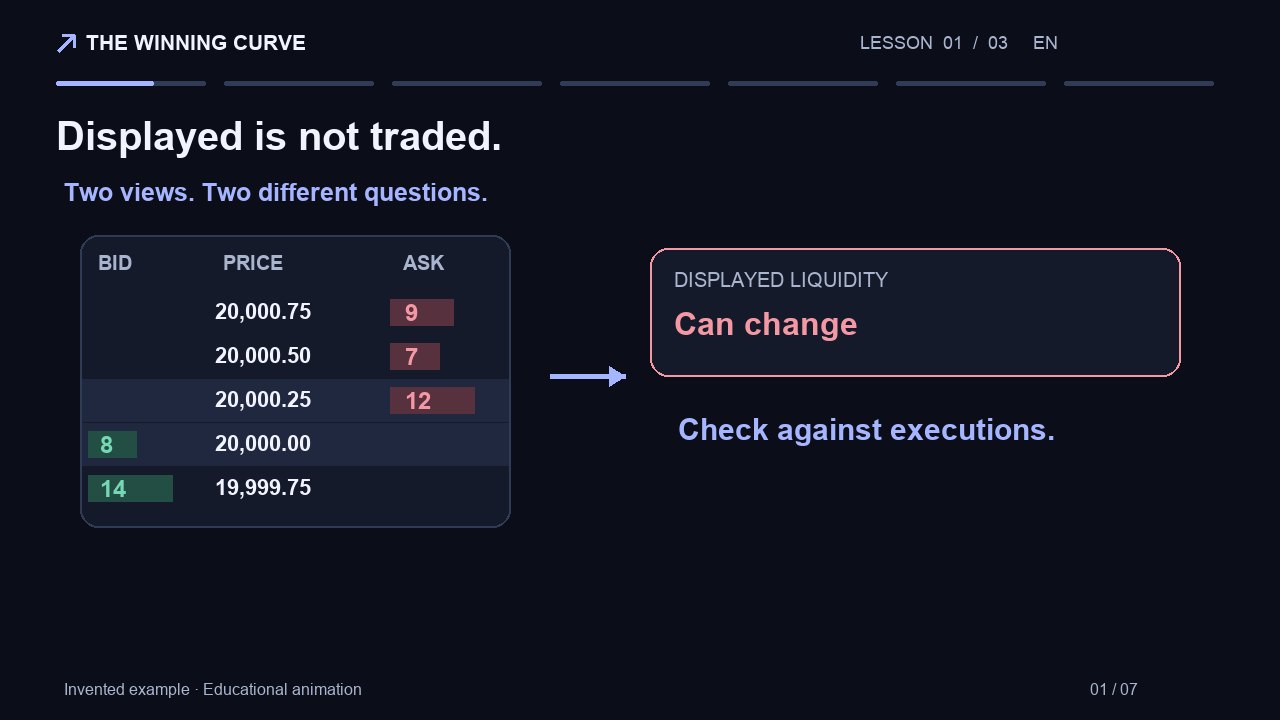
- DOM: what displayed quantity changed around the same time? A screenshot alone cannot explain the sequence.
A worked example: the same price, two different stories
The table below is an invented teaching example. It is not a recording from the demo, an empirical threshold or a trading signal. Each row describes a separate ten-second window in one hypothetical instrument. “Ask volume” means contracts executed at the contemporaneous ask in this example.
On a small screen, scroll the table horizontally.
| Window | Ask volume | Highest traded price | Observation |
|---|---|---|---|
| A · first 10 seconds | 24 contracts | 20,000.25 | Several trades reach this price. |
| B · next 10 seconds | 58 contracts | 20,000.25 | More ask-side volume; no higher trade. |
| C · first 10 seconds | 24 contracts | 20,000.25 | A separate attempt reaches this price. |
| D · next 10 seconds | 5 contracts | 20,000.25 | Fewer ask-side trades; long gaps between them. |
- A → B: investigate possible absorption. You still need the sequence of book updates and transactions around the level.
- C → D: investigate possible exhaustion. Check whether the whole market slowed or only the buying activity.
- Both comparisons lack the next price sequence. Neither tells you whether to buy or sell.
What would weaken your explanation?
Treat your first label as a hypothesis. Suppose the observation above covers two different contract months, or the second window was played at a different speed. The comparison is not controlled. If a minimum-size filter changed, missing small prints can also make the tape look quieter.
For an absorption hypothesis, note whether trades actually occurred at the price you are studying. A large resting quantity with no corresponding executions is not the same evidence. For an exhaustion hypothesis, compare equal amounts of market time and record the surrounding activity. “I did not see a large print” is not a volume measurement.
If you cannot reconstruct the sequence, record “unclear”. Do not infer a specific institution, an iceberg order or a trader’s intention from the displayed size alone. Your notes should separate the observation from the explanation you would like to be true.
Practise without looking at what happens next
Open the free NQ Replay and choose a short interval before viewing its outcome. The demo contains one recorded 15-minute session from September 25, 2026, beginning at 10:00 New York time. It is a practice environment with simulated orders, not a live feed. You do not need to place an order for this exercise.
- First pass: watch at normal speed. Record a timestamp where volume and price response appear different from the preceding interval. Do not require the session to contain a textbook pattern.
- Pause: write the facts you saw, your tentative explanation and one fact that would weaken it. Keep the explanation separate from the observation.
- Second pass: revisit the same interval using the same tape settings. Check the DOM and the transaction sequence. Correct your notes rather than changing the timestamp to fit the story.
- Review: reveal the following interval only after writing your hypothesis. Record the outcome, including cases that stay ambiguous. A correct description is a useful result even when there is no simulated trade.
Three questions to check your reading
Use the fictional table before trying to classify a fast-moving session. Answer from the information available, without inventing the next candle.
- Can window B alone prove an institution is selling? No. The table contains transactions and prices, not participant identity.
- Does window D prove the price will fall? No. Reduced activity does not provide the next price or establish a reversal.
- What should you add to the journal? The exact interval, settings, price response, evidence you could not verify and what happened after you wrote the hypothesis.
Common questions
Can absorption and exhaustion appear in the same sequence?
Yes. A sequence can first show transactions meeting liquidity and later show reduced participation. Describe the intervals separately instead of forcing one label onto the whole move.
Is a large DOM order enough to identify absorption?
No. Start by checking whether transactions actually occurred at that level and how the price responded. Displayed size alone does not describe the executions.
Is there a minimum volume that proves absorption?
This guide provides no such threshold. The figures in the exercise are fictional. Contract, time of day, data coverage and observation window all affect a comparison.
Can I practise this without a footprint chart?
You can practise the observation method with the DOM and Time & Sales in the demo. Keep the task narrow: record transactions, price response and uncertainty. The exercise does not require a footprint or an automated absorption indicator.
Published by The Winning Curve. Invented examples are labelled; screenshots show our interface. A correction or question about this guide? thewinningcurve@gmail.com