Complete transcript
0:00 One row is not one trader.
Time and Sales shows executions. But one displayed row does not always mean one original print or one trader. Let's use an invented example to see what grouping changes.
0:11 Read a print.
Start with price and size. A size of three means three contracts in the reported print. Colours often classify executions relative to the bid or ask. They do not identify who traded, and classification depends on the data and platform.
0:27 Three prints, six contracts.
Imagine three executions at the same price and on the same classified side, close together in time. Their sizes are three, two and one. A grouping rule can display one row of six contracts.
0:41 The volume is unchanged.
Grouping changes the presentation, not the total volume in these three prints. It does not prove that one trader submitted a six-contract order. Compare the price, side and time window used by the platform.
0:55 Compare the price response.
A fast tape is activity, not a direction forecast. Ask whether the price advances after the executions or remains at the same level. Compare equal time intervals with the same grouping and playback speed.
1:08 A ten-second exercise.
In Replay, choose one price and watch ten seconds. Note the executed volume and the response of the price. Pause, write your observation and repeat. Do not count coloured rows as separate traders.
1:22 Watch it in the Replay.
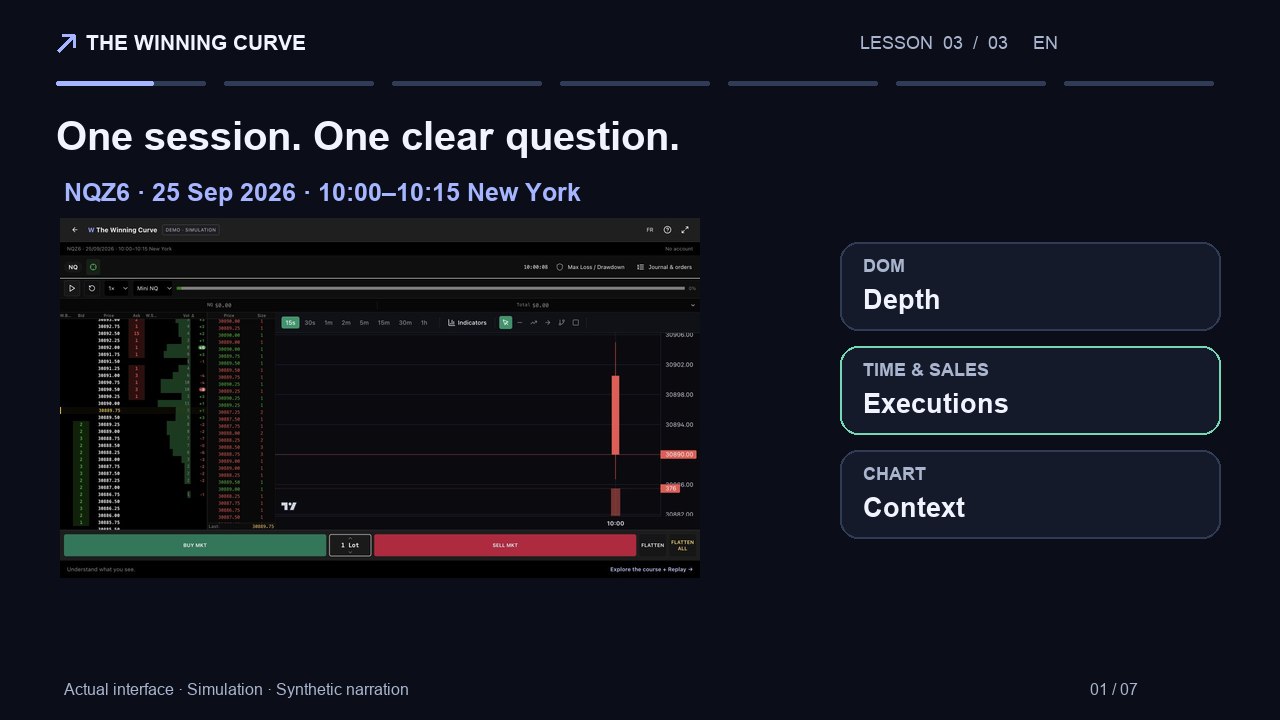
Use the free NQ Replay to put the tape next to the order book and chart. Read the companion guide for more examples. The session is recorded and any orders you place are simulated.
YOUR TURN
Turn the lesson into an observation.
Watch ten seconds at a fixed playback speed. Note the volume at one price and whether the price moves. Keep the same grouping settings when comparing a second interval.
References and method
This lesson is published by The Winning Curve. Illustrated examples are separate from the session offered in the demo. The reference below documents the topic or the recording provenance.
A correction or a question? thewinningcurve@gmail.com
Continue with a structured course.
The order flow course includes Replay for practice. DOM Live remains a separate beta by request.
Explore the course programme →